Dose-Response Curves in R
Introduction
Abstract
In clinical research the dose–response relationship is often non-linear, therefore advanced fitting models are needed to capture their behavior. The talk will concentrate on fitting non-linear parametric models to the dose–response data and will explain some specificities of this problem.
The talk is based on the book by Christian Ritz, Jens Carl Streibig “Nonlinear regression with R”.
Purpose of Dose-Response Information
ICH E4 Harmonized Tripartite Guideline
Knowledge of the relationships among dose, drug-concentration in blood, and clinical response (effectiveness and undesirable effects) is important for the safe and effective use of drugs in individual patients. It helps identify
an appropriate starting dose,
the best way to adjust dosage to the needs of a particular patient,
a dose beyond which increases would be unlikely to provide added benefit or would produce unacceptable side effects.
Example
There are other fields of studies were concentration analysis can be used.
Consider the following relationship (Chwirut2 is included in the package NISTnls), where the response variable is ultrasonic response, and the predictor variable is metal distance.
#library(NISTnls)
dim(Chwirut2)
## [1] 54 2head(Chwirut2)## y x
## 1 92.9000 0.500
## 2 57.1000 1.000
## 3 31.0500 1.750
## 4 11.5875 3.750
## 5 8.0250 5.750
## 6 63.6000 0.875A distance-amplitude relationship of attenuation that an ultrasound beam experiences traveling through a medium
#library(ggplot2)
g <- ggplot(data=Chwirut2,aes(x=x,y=y)) +
  geom_point() + xlab("Metal distance") + ylab("Ultrasonic respons")
g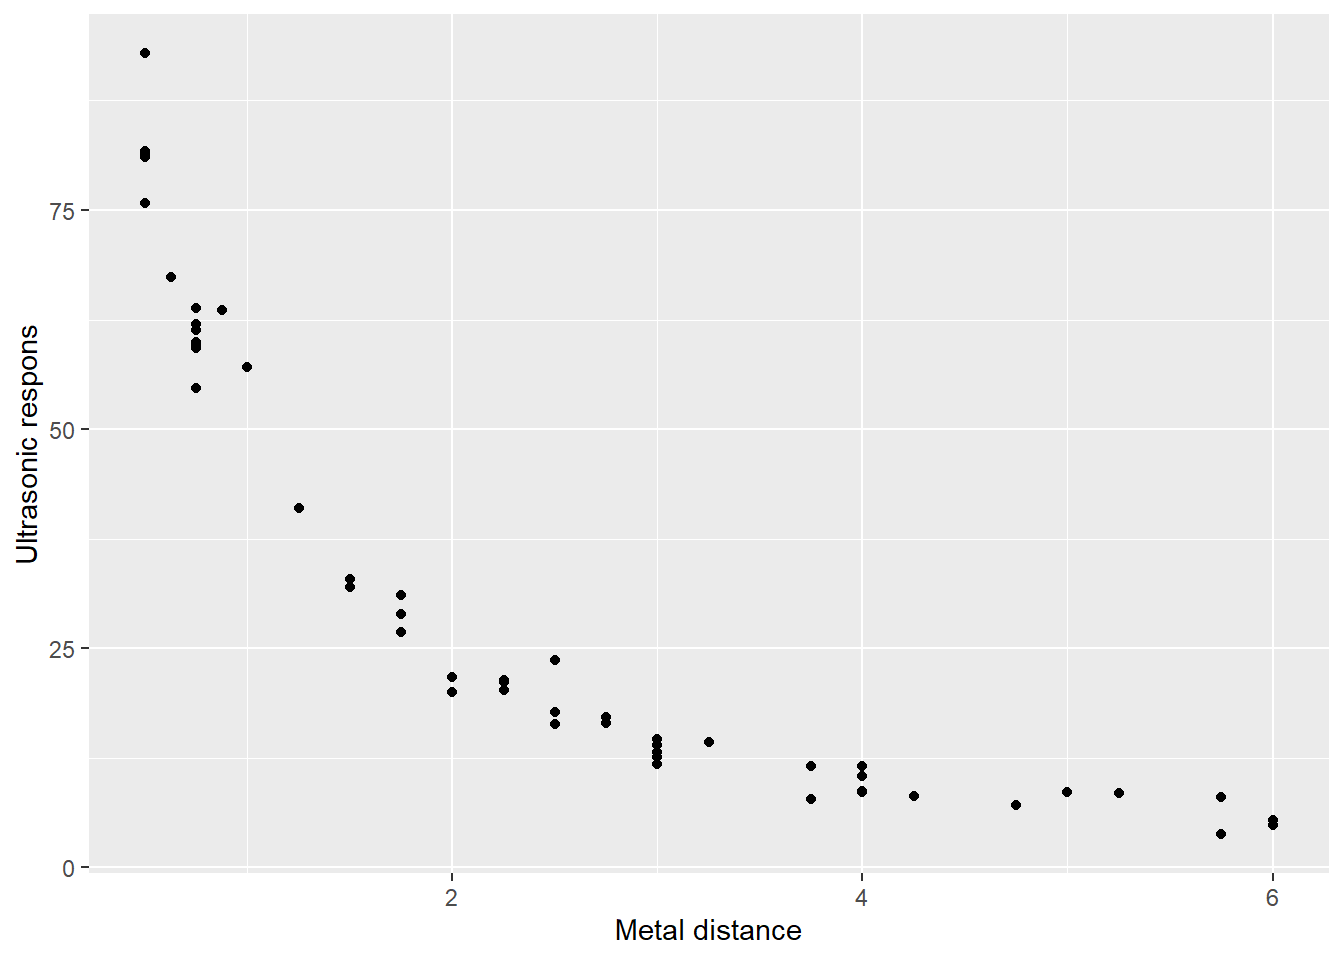
The built-in function nls()
Fitting a parametric family
Suppose we observe the following pair of data points \((x_i,y_i),\,i=1,\cdots,n.\) Consider a parametric family (usually non-linear) that we want to fit to the data \[f(x,(\theta_1,\cdots,\theta_k)).\] The hypothesis is that there is the following relationship between observed points
\[y_i=f(x_i,(\theta_1,\cdots,\theta_k))+\varepsilon_i,\ \ i=1,\cdots,n.\]
The fitting method that we are going to use is the Non-linear Least Squares (NLS) method. NLS estimates can be found using this minimization problem.
\[(\hat\theta_1,\cdots,\hat\theta_k)=\arg\min_{\theta_1,\cdots,\theta_k}\sum_{i=1}^n(y_i-f(x_i,(\theta_1,\cdots,\theta_k)))^2.\]
Gauss - Newton algorithm
The Gauss - Newton algorithm is used to solve the optimization problem described above.
If we denote \(g_i(\theta)=y_i-f(x_i,\theta), \ \ \theta=(\theta_1,\cdots,\theta_k),\) then the minimization problem is the following \[\min_{\theta\in R^k}\sum_{i=1}^ng_i^2(\theta)=\min_{\theta\in R^k}||g(\theta)||^2.\] Choose an initial value \(\theta_0\) and linearize the function \(g(\theta)\) around \(\theta_0\) as follows
\[\hat g(\theta,\theta_0)=g(\theta_0)+Dg(\theta_0)(\theta-\theta_0).\] Solving \(\min_{\theta\in R^k}||g(\theta_0)+Dg(\theta_0)(\theta-\theta_0)||^2,\) where \(m\times n\) matrix \(Dg(\theta)\) is the Jacobian, we get \(\theta_1\) and continuing this process interatively, we get the sequence \((\theta_m),\,m=0,1,\cdots.\) Moreover, if \(Dg(\theta_k)\) has linearly independent columns,
\[\theta_{k+1}=\theta_k-\left([Dg(\theta_k)]^TDg(\theta_k)\right)^{-1}[Dg(\theta_k)]^Tg(\theta_k).\] The question is - how to choose the initial value \(\theta_0\) of iteration?
The parametric family
The following parametric family was suggested to fit the distance-amplitude relationship
\[f(x,(\beta_1,\beta_2,\beta_3))=\frac{\exp(-\beta_1x)}{\beta_2+\beta_3x}\] Assumptions:
correct mean function \(f\)
variance homogeneity (homoscedasticity)
normally distributed measurements errors
mutually independent measurement errors \(\varepsilon_i\)
- If we take \(x=0\) then we get \(f(0,(\beta_1,\beta_2,\beta_3))=\frac{1}{\beta_2}\) so the initial estimate of \(\beta_2\) can be the reciprocal of the response value closest to the \(y\) axis, that is, roughly, \(\frac{1}{100}=0.01.\) For the
Fitting non-linear parametric family
expFct <- function(x,beta1,beta2=0.01,beta3)  exp(-beta1*x)/(beta2+beta3*x)
l <- list(beta1=0.1, beta2=0.01, beta3=0.001)
fit <- nls(data=Chwirut2, y ~ expFct(x, beta1, beta2, beta3), start=l)
fit
## Nonlinear regression model
## model: y ~ expFct(x, beta1, beta2, beta3)
## data: Chwirut2
## beta1 beta2 beta3
## 0.166576 0.005165 0.012150
## residual sum-of-squares: 513
##
## Number of iterations to convergence: 9
## Achieved convergence tolerance: 7.467e-07tidy(fit)## # A tibble: 3 × 5
## term estimate std.error statistic p.value
## <chr> <dbl> <dbl> <dbl> <dbl>
## 1 beta1 0.167 0.0383 4.35 6.56e- 5
## 2 beta2 0.00517 0.000666 7.75 3.54e-10
## 3 beta3 0.0122 0.00153 7.94 1.81e-10Plotting the fitted non-linear function
Hence, we can plot the fitted curve
#library(broom)
values <- tidy(fit)$estimate
g + stat_function(fun=expFct, args=values, colour="blue", lwd=1)
## Warning: Using `size` aesthetic for lines was deprecated in ggplot2 3.4.0.
## ℹ Please use `linewidth` instead.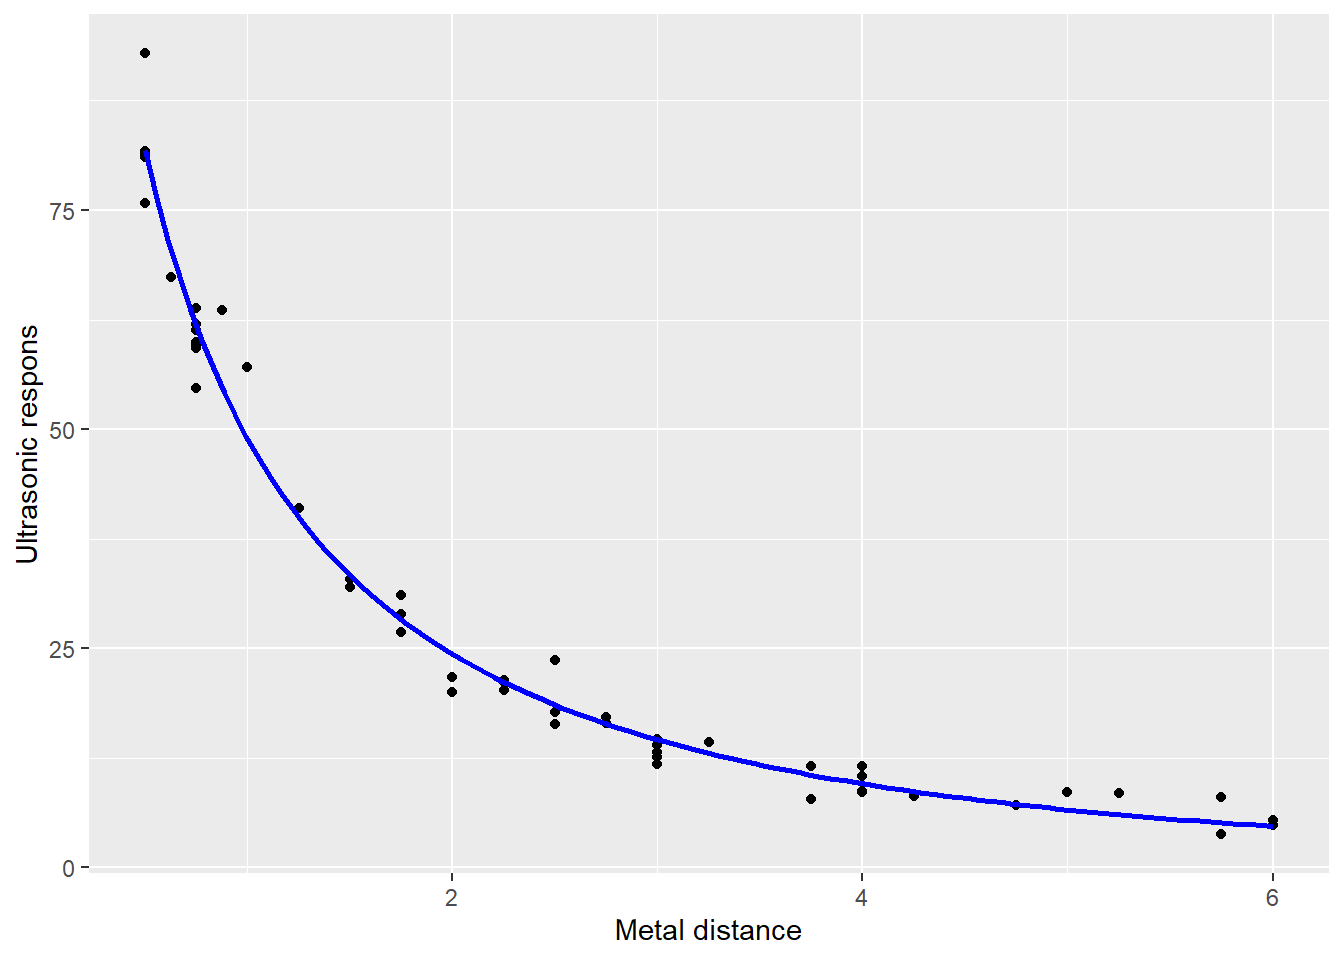
The package nls2
Searching a grid
The procedure of finding initial points for the minimization iteration can be automated in the following way. In case the range of the parameter estimates can be envisaged grid search can be carried out:
- the residual sums-of-squares \(RSS(\beta),\,\beta=(\beta_1,\cdots,\beta_k)\) is calculated for all the values in the intervals
- starting values are chosen in the way to provide the smallest value of \(RSS(\beta)\).
In our example, having \(\beta_2=0.01,\) for other two parameters, knowing only that they are positive numbers, we can search in the interval \([0.1,1]\) taking the step size equal to \(0.1.\)
Create a data.frame containing all possible combinations of suggested initial values for the parameters
beta1 <- seq(0.1, 1, by = 0.1)
beta2 <- 0.01
beta3 <- seq(0.1, 1, by = 0.1)
grid.Chwirut2 <- expand.grid(list(beta1 = beta1, beta2 = beta2, beta3 = beta3))
head(grid.Chwirut2)
## beta1 beta2 beta3
## 1 0.1 0.01 0.1
## 2 0.2 0.01 0.1
## 3 0.3 0.01 0.1
## 4 0.4 0.01 0.1
## 5 0.5 0.01 0.1
## 6 0.6 0.01 0.1The nls2() function
nls2() function differs from the original function by a way that it provides the possibility to specify a data frame of values of starting points. Its argument algorithm=“brute-force” evaluates RSS for the parameter values provided through the start argument.
library(nls2)fit2 <- nls2(data = Chwirut2, y ~ expFct(x, beta1, beta2, beta3),
start = grid.Chwirut2, algorithm = "brute-force")
fit2## Nonlinear regression model
## model: y ~ expFct(x, beta1, beta2, beta3)
## data: Chwirut2
## beta1 beta2 beta3
## 0.10 0.01 0.10
## residual sum-of-squares: 60696
##
## Number of iterations to convergence: 100
## Achieved convergence tolerance: NAFitting using the function nls2()
Fitting procedure can be continued this way: replace the value of the start argument by fit2 and leave out the argument algorithm
tidy(nls2(data = Chwirut2, y ~ expFct(x, beta1, beta2, beta3), start=fit2))## # A tibble: 3 × 5
## term estimate std.error statistic p.value
## <chr> <dbl> <dbl> <dbl> <dbl>
## 1 beta1 0.167 0.0383 4.35 6.56e- 5
## 2 beta2 0.00517 0.000666 7.75 3.54e-10
## 3 beta3 0.0121 0.00153 7.94 1.81e-10Self-Starter functions
Automating further the search for initial points
- Self-starter functions are special type of functions. They are implementations of specific given mean functions and designed in a way to calculate starting values for a given dataset. They can be thought as the definition of the parametric family combined with the logic of how to choose initial values based on the given dataset.
- We have already encountered such example: for the parametric family \[f(x,(\beta_1,\beta_2,\beta_3))=\frac{\exp(-\beta_1x)}{\beta_2+\beta_3x}\] we said that the initial estimate of \(\beta_2\) can be the reciprocal of the response value closest to the \(y\) axis. So, if we find also logic of choosing initial values for \(\beta_1\) and \(\beta_3,\) then we can add these logics into the definition of this parametric family and get a Self-Starter function.
- We will construct a Self-Starter function later, but before that we will explore the built-in Self-Starter functions.
Built-in Self-Starters
Consider the following dataset
dat <- data.frame(
  conc = c(2.856829,  5.005303,  7.519473,  22.101664,
         27.769976,  39.198025,  45.483269, 203.784238),
rate = c(14.58342, 24.74123, 31.34551, 72.96985, 77.50099,
         96.08794, 96.96624, 108.88374)
)
dat
## conc rate
## 1 2.856829 14.58342
## 2 5.005303 24.74123
## 3 7.519473 31.34551
## 4 22.101664 72.96985
## 5 27.769976 77.50099
## 6 39.198025 96.08794
## 7 45.483269 96.96624
## 8 203.784238 108.88374g <- ggplot(data = dat, aes(x = conc, y = rate)) + geom_point()
g
The Michaelis-Menten model
We are going to fit this data using the parametric family of Michaelis-Menten functions
\[f(x,(V_m,k))=\frac{V_m x}{K+x}.\]
- Here the constants \(V_m\) and \(K\) are positive. \(V_{m}\) represents the maximum rate achieved by the system, at saturating substrate concentration. The constant \(K\) is the substrate concentration at which the reaction rate is half of \(V_m.\)
- Again we can interactively find the initial estimates for the parameters to fit the NLS curve. But there is a built-in Self-Starter function called SSmicmen() which has a logic inscribed in it which lets it work with nls() without specifying starting points.
fit3 <- nls(rate ~ SSmicmen(conc, Vm, K), data = dat)
tidy(fit3)
## # A tibble: 2 × 5
## term estimate std.error statistic p.value
## <chr> <dbl> <dbl> <dbl> <dbl>
## 1 Vm 126. 7.17 17.6 0.00000218
## 2 K 17.1 2.95 5.78 0.00117g + stat_function(fun = SSmicmen, args = list(Vm = tidy(fit3)$estimate[1],
K=tidy(fit3)$estimate[2]),
colour = "darkgreen")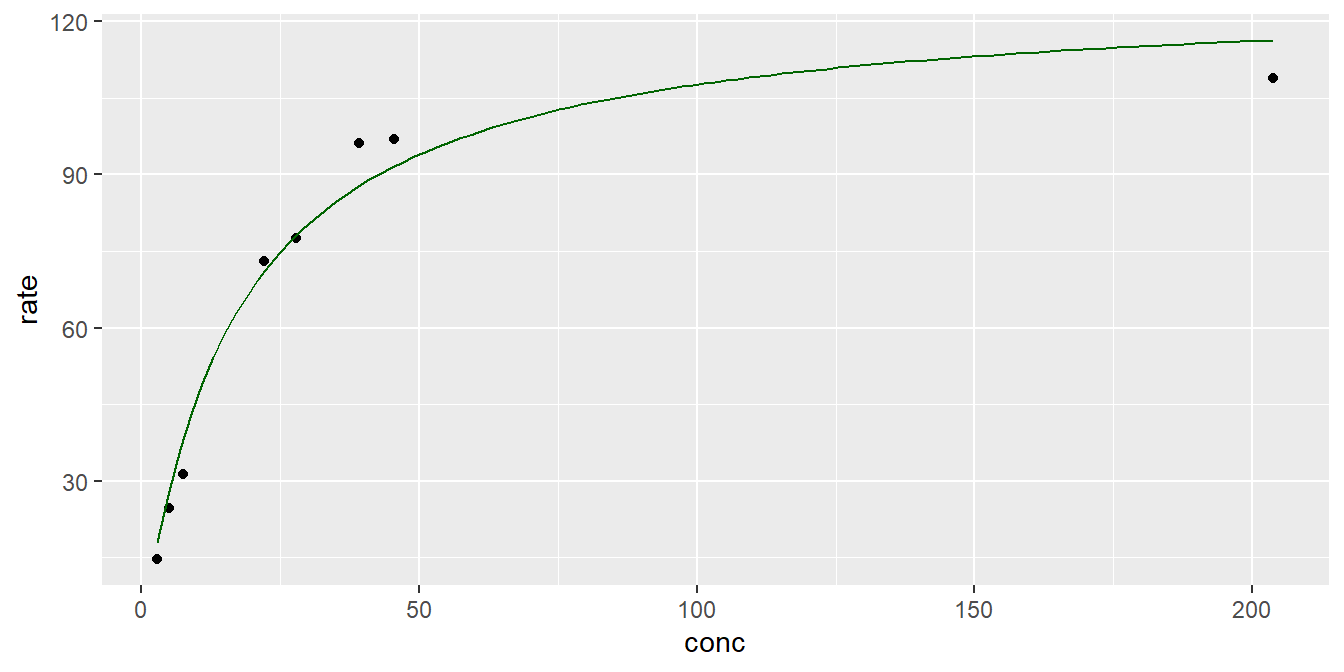
Defining Self-Starter functions
A simple example
Consider the following parametric family
\[f(x,(b,y_0))=y_0 e^{\frac{x}{b}}.\]
- This model can be used to describe radioactive decay. The parameter \(y_0\) is the initial amount of the radioactive substance (at time \(x = 0\)). The rate of decay is governed by the second parameter \(b\) (the inverse decay constant).
- The definition of a self-starter contains the formula of the parametric family, a logic of constructing initial values for parameters, a function taking the dataset as argument and other arguments ensuring that the logic of construction of initial values, the definition of parametric family and nls() are tied together.
The logic of construction of initial values
Apply the log transform on the given mean function
\[\log f(x,(b,y_0))=\log y_0+\frac{x}{b}.\]
Hence, if we apply the log transform on the response data, we can apply linear regression techniques to estimate the slope and the intercept, then, from the equalities
\[\log\tilde y_0={\beta_0}, \ \ \tilde \beta_1=\frac{1}{b}\] we get
\[\tilde y_0=e^{\tilde \beta_0}, \ \ \tilde b=\frac{1}{\tilde\beta_1}.\] This is the logic of construction of initial parameter values that we need to include in the definition of a Self-Starter.
(We are not interested in the error structure that will change after the transformation, because we need only initial estimates.)
The match.call() function
The function match.call() can be used in the definition of the function to store the call in the resulting object. In addition, if that function is called without specifying the arguments, the function match.call() matches the arguments to their names by their positions. Observe below
Func <- function(input, parameter){
  value <- input^parameter
  attr(value,"call") <- match.call()
  value
}
power <- Func(2,16) #observe that we did not specify the names of parameters
power
## [1] 65536
## attr(,"call")
## Func(input = 2, parameter = 16)Hence, their argument values can be extracted from the call by their names as from a list
attr(power,"call")$parameter## [1] 16Three steps
- Define the mean function
expModel <- function(predictor,b, y0) {
  y0 * exp(predictor/b)
}
- Define the function with the initialization logic
expModelInit <- function(mCall, LHS, data) {
 xy <- sortedXyData(mCall[["predictor"]], LHS, data)
 lmFit <- lm(log(xy[, "y"]) ~ xy[, "x"])
 coefs <- coef(lmFit)
 y0 <- exp(coefs[1])
 b <- 1/coefs[2]
 value <- c(b, y0)
 names(value) <- c("b","y0")
 value
}
Define the Self-Starter function
Specificities of working in a Markdown Environment
SSexp <- selfStart(expModel, expModelInit, c("b", "y0"))
class(SSexp)
## [1] "selfStart"RStudio actually creates a separate R session to render the document. This causes problem with the getInitial() function which searches for user created SS functions in the Global environment and cannot find them because they are created in a new environment only for the Markdown use. Hence, we need to ensure that our created Self-Starter is defined in the Global environment.
#Only for Markdown execution
l <- list(SSexp = SSexp)
list2env(l, envir = .GlobalEnv)
## <environment: R_GlobalEnv>Getting the inital values
Self-starters can be passed as an argument to the function getInitial() to obtain the initial values. Consider the following dataset
load(file = "RGRcurve.rda")
head(RGRcurve)
## Day RGR
## 1 0 0.169
## 2 0 0.164
## 3 0 0.210
## 4 0 0.215
## 5 0 0.183
## 6 0 0.181Then, the initial values, determined according to our logic, will be
getInitial(RGR ~ SSexp(Day, b,y0), data = RGRcurve)## Warning: selfStart initializing functions should have a final '...' argument
## since R 4.1.0## b y0
## 3.8450187 0.1674235Fitting by user defined SS
fit4 <- nls(RGR ~ SSexp(Day, b,y0), data = RGRcurve)## Warning: selfStart initializing functions should have a final '...' argument
## since R 4.1.0getInitial(RGR ~ SSexp(Day, b,y0), data = RGRcurve)## Warning: selfStart initializing functions should have a final '...' argument
## since R 4.1.0## b y0
## 3.8450187 0.1674235# Compare the initial values with the estimated values
tidy(fit4)## # A tibble: 2 × 5
## term estimate std.error statistic p.value
## <chr> <dbl> <dbl> <dbl> <dbl>
## 1 b 3.76 0.175 21.5 3.40e-23
## 2 y0 0.164 0.0142 11.5 4.03e-14g <- ggplot(data = RGRcurve, aes(x = Day, y = RGR)) + geom_point()
g + stat_function(fun = SSexp, args=tidy(fit4)$estimate, colour="darkgreen")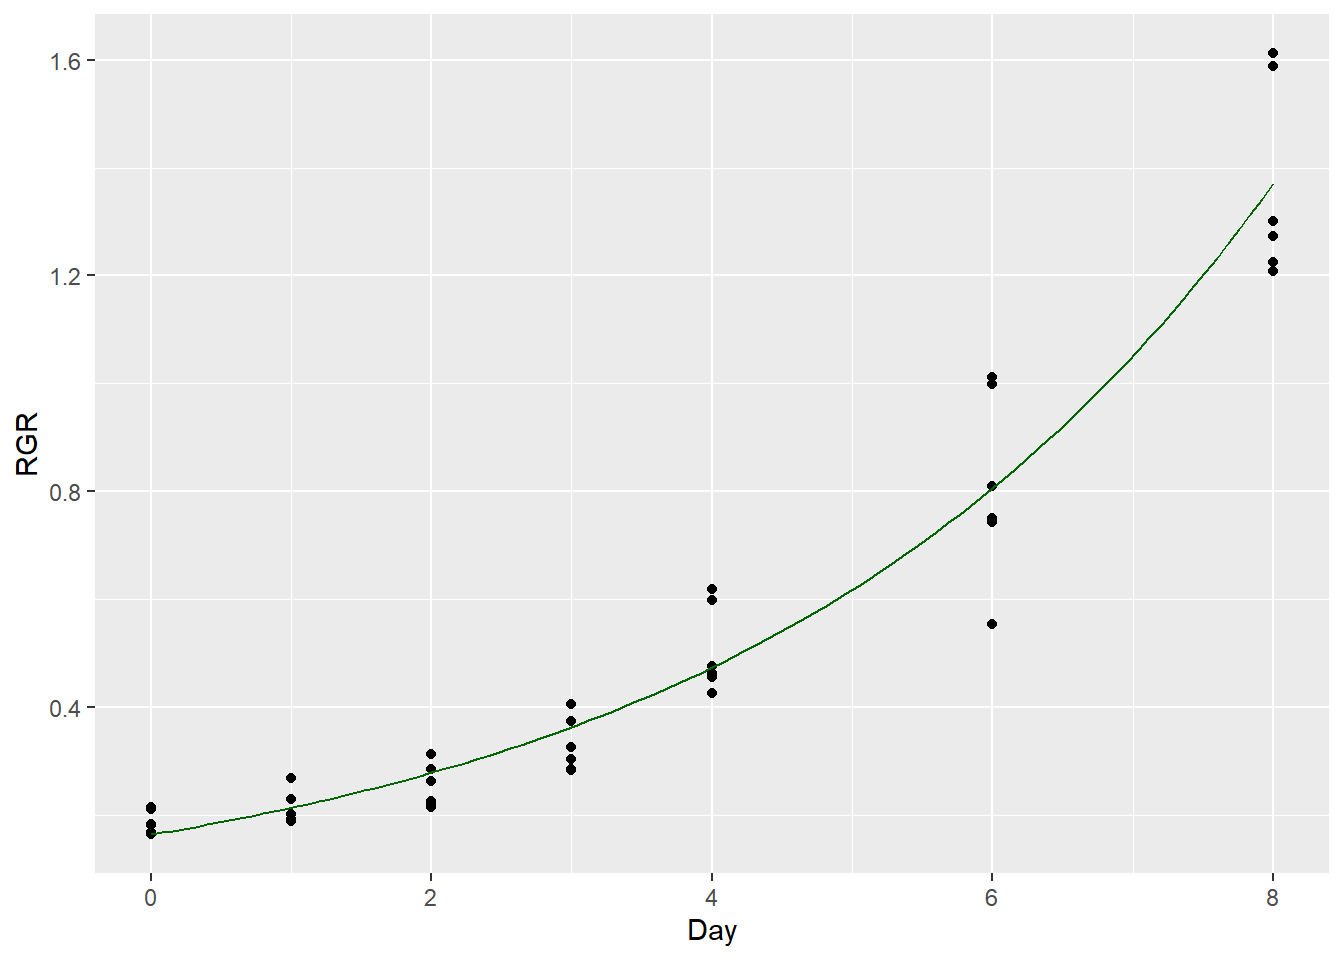
Difficult Example
Returning to the difficult example
Considering once again the parametric family
\[f(x,\beta)=\frac{\exp(-\beta_1x)}{\beta_2+\beta_3x},\ \ \beta=(\beta_1,\beta_2,\beta_3).\] We can use Taylor’s formula
\[f(x,\beta)\approx f(0,\beta)+f'(0,\beta)x,\ \ x\approx 0.\] Simplifying this and remembering that \(f(0,\beta)=\frac{1}{\beta_2}\) we get \[f(x,\beta)\approx \frac{1}{\beta_2}-\frac{1}{\beta_2}\left(\beta_1+\frac{\beta_3}{\beta_2}\right)x.\] Which in turn gives the equality \[1-\beta_2 f(x,\beta)=\left(\beta_1+\frac{\beta_3}{\beta_2}\right)x,\] hence, transforming the data according to the left hand side and fitting a linear model without an intercept we can estimate \(\left(\beta_1+\frac{\beta_3}{\beta_2}\right).\) For two parameters out of three we have a rule to find starting values, for the third one we still need a guess. Taking \(\beta_1=0\) may work.
expFctInit <- function(mCall, LHS, data){
  xy <- sortedXyData(mCall[["x"]], LHS, data)
  beta2 <- 1/xy[1,"y"]
  coefs <- coef(lm(1-beta2*xy[,"y"]~xy[,"x"]+0))
  beta1 <- 0
  beta3 <- coefs*beta2
  value <- c(beta1, beta2, beta3)
  names(value) <- c("beta1", "beta2", "beta3")
  value
}
SSexpFct <- selfStart(expFct, expFctInit, c("beta1", "beta2", "beta3"))
l <- list(SSexpFct=SSexpFct)
list2env(l, envir = .GlobalEnv)#Only for Markdown execution
## <environment: R_GlobalEnv>getInitial(data = Chwirut2, y ~ SSexpFct(x, beta1, beta2, beta3))## Warning: selfStart initializing functions should have a final '...' argument
## since R 4.1.0## beta1 beta2 beta3
## 0.000000000 0.012140834 0.002537341fit0 <- nls(data = Chwirut2, y ~ SSexpFct(x, beta1, beta2, beta3))## Warning: selfStart initializing functions should have a final '...' argument
## since R 4.1.0fit0_tidy <- tidy(fit0)
fit0_tidy$p.value <- format.pval(fit0_tidy$p.value,eps=0.001,digits=3)
CI <- as.data.frame(suppressMessages(confint(fit0)))
CI$term <- row.names(CI)
fit0_tidy <- merge(fit0_tidy,CI,by="term")
fit0_tidy[,!names(fit0_tidy)%in%c("term", "p.value")]<-
round(fit0_tidy[,!names(fit0_tidy)%in%c("term", "p.value")], 3)
fit0_tidy## term estimate std.error statistic p.value 2.5% 97.5%
## 1 beta1 0.167 0.038 4.349 <0.001 0.094 0.254
## 2 beta2 0.005 0.001 7.753 <0.001 0.004 0.006
## 3 beta3 0.012 0.002 7.939 <0.001 0.009 0.015Here, we used the generic function \(confint()\) on the object of class \(nls\) and got the confidence intervals for the parameters estimates. In addition, the function \(format.pval()\) was used to simplify the presentation of p.values.
values <- tidy(fit0)$estimate
g <- ggplot(data = Chwirut2, aes(x = x, y = y))+
  geom_point() + xlab("Metal distance") + ylab("Ultrasonic respons")
g + stat_function(fun = expFct, args = values,
                  colour="blue", lwd=1)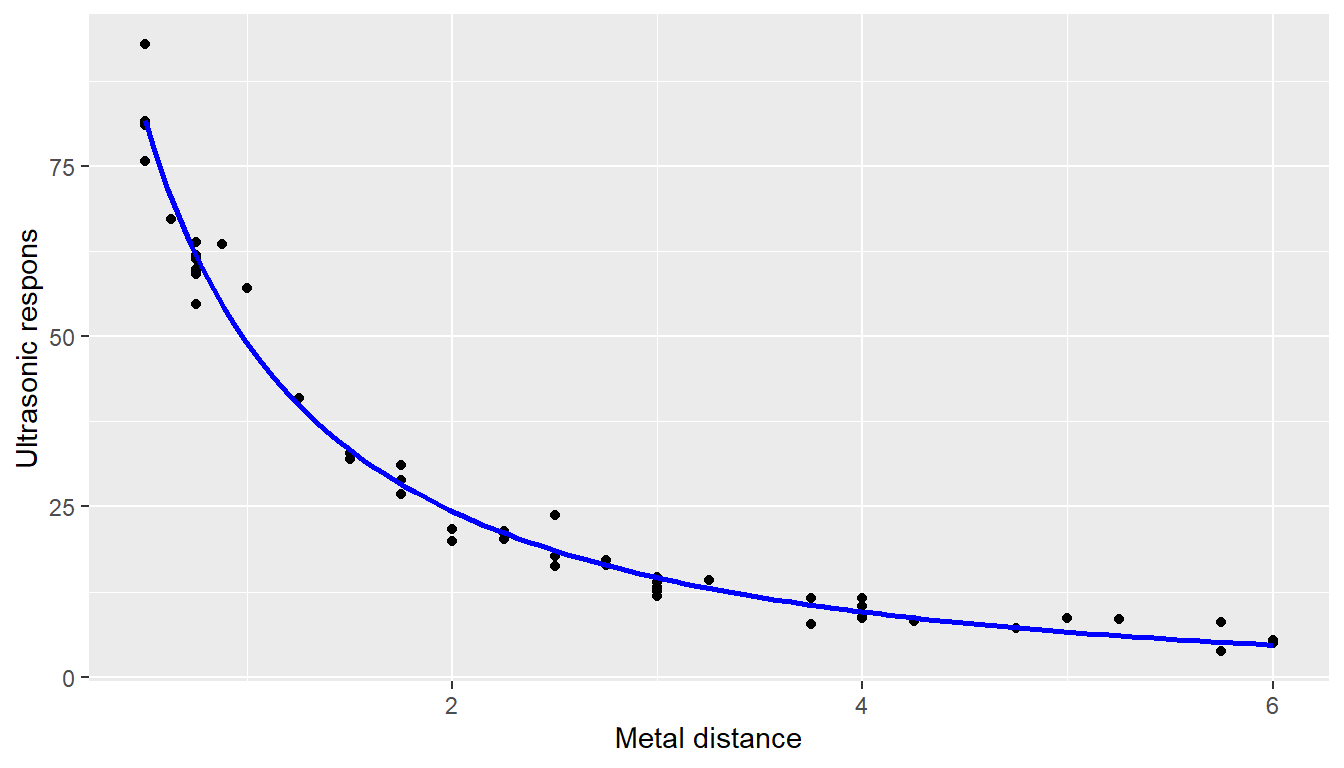
predict(fit0, newdata = data.frame(x=6:7))## [1] 4.715006 3.453957Further Reading
The package drc (Dose-Response curves) contains much more prespecified parametric families (22, to be exact - run drc::getMeanFunctions() to see the list).
The package nlme (Linear and Nonlinear Mixed Effects Models) which allows the inclusion of the donor effect as a random effect in dose-response studies.
More robust algorithms for fitting (The Levenberg-Marquardt curve-fitting method)
The Levenberg-Marquardt method
The Levenberg-Marquardt curve-fitting method is a combination of the two other minimization methods: the gradient descent method and the Gauss-Newton method.
In the gradient descent method, the sum of the squared errors is reduced by updating the parameters in the steepest-descent direction.
In the Gauss-Newton method, the sum of the squared errors is reduced by assuming the least squares function is locally quadratic, and finding the minimum of the quadratic.
The Levenberg-Marquardt method acts more like a gradient-descent method when the parameters are far from their optimal value, and acts more like the Gauss-Newton method when the parameters are close to their optimal value.
Henri P. Gavin, The Levenberg-Marquardt method for nonlinear least squares curve-fitting problems
Presentation
Below is a presentation version of this lecture which contains also interactive applications for curve fitting.